


People and policy meet seasonality and flow. This combined read explains what happened in Tokyo, what September usually does to BTC, and how ETF flows can amplify moves. The goal is practical guidance without hype.
Daily Market Pulse
| Metric | Status today | Read |
|---|---|---|
| BTC perp funding | Neutral to slightly negative | positioning is light and responsive |
| Open interest | Flat day over day | leverage is not forcing the tape |
| BTC dominance | Sideways after late August uptick | rotation pauses while majors digest |
| Thirty day realized volatility | Rising vs last month | larger intraday ranges return |
What happened in Tokyo and why it matters
Eric Trump appeared in Tokyo as Metaplanet stockholders approved a capital plan to sell new shares for proceeds that will be used mainly to buy more bitcoin. The signal is simple. A public company in Japan is raising fresh capital with a plan that prioritizes BTC allocation. That keeps the treasury adoption story alive in Asia and it adds a macro narrative into a month that is usually difficult for BTC.
September is often weak for BTC
Seasonality does not decide outcomes but it shapes expectations. For twelve years September has been one of the softest months for BTC on average. Liquidity is uneven, macro calendars restart and allocators rebalance after the summer. That mix can turn small catalysts into bigger moves. Use seasonality as a bias not as a rule.
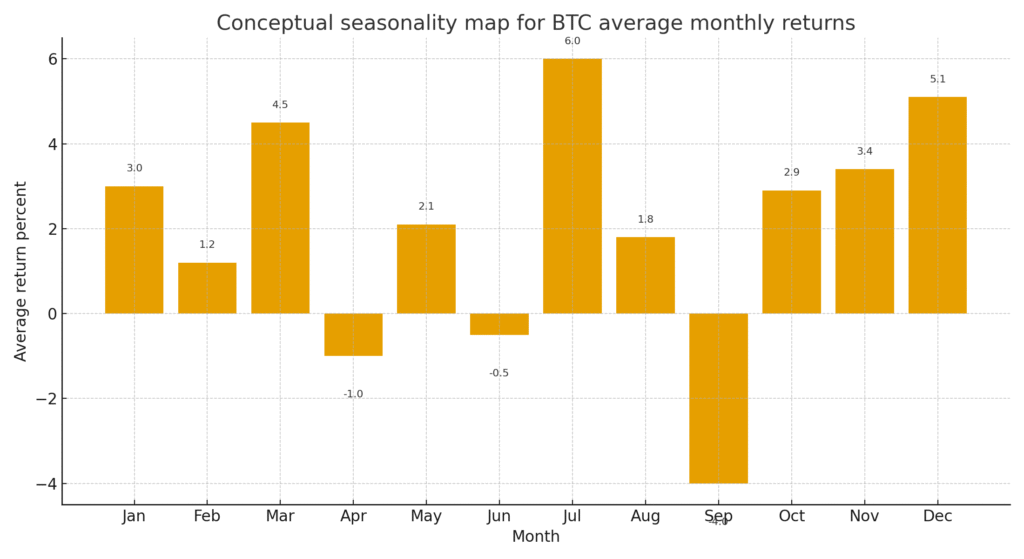
Figure 1. Bar chart of BTC average monthly returns with September below zero on average
The one hundred seven handle and the risk map
BTC opened September near one hundred seven thousand and briefly slipped under one hundred eight thousand as traders weighed macro signals. A cluster of stops sits below recent supports. If those give way on volume, a slide toward one hundred five and then one hundred could follow before buyers attempt a rebuild. If buyers defend the first shelf with strong response, the path back to one hundred ten opens quickly.
ETF flows and price action
When both spot BTC and gold funds show outflows in the same week, the message is often de risk before catalysts. Outflows do not break the hedge case by themselves. They tell you that allocators are raising cash into events. Watch if flows normalize after the event. If creations return, the dip was a hedge not a trend change.
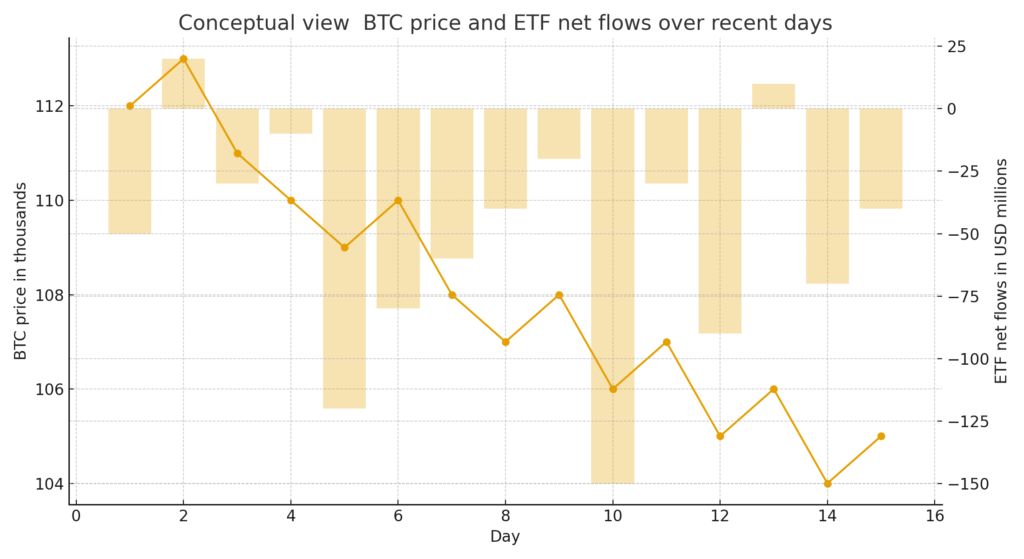
Figure 2. Dual axis chart with BTC price as a line and ETF net flows as bars across recent days.
Scenario map for September
| Scenario | Setup | What to watch | Plan |
| Grind lower into supports | Weak seasonality plus light outflows | first shelf near recent Asia and Europe supports | reduce size and wait for reclaim |
| Fast flush then rebuild | Stops trigger then buyers step in | reversal wicks and calmer funding | scale in only after higher low |
| Surprise upside | Macro print eases rate path | flip in ETF flows and stronger bid in U S hours | add exposure in steps not all at once |
Checklist for decision makers
Track creations and redemptions in spot ETFs each U S session.
Separate trading time frames from allocation time frames so seasonality bias does not distort mandates.
Raise the use of alerts at session pivots to avoid chasing weak moves.
Stress test liquidity during Asia hours if your venue depends on those windows.